Gold Market Analysis Report
Date: December 8, 2024,
Prepared by: Patrick MontesDeOca
Target Audience: Gold Market Analysts, Traders, and Investors
Executive Summary
This report provides an analysis of the weekly gold market, highlighting key technical indicators, price momentum, and strategic trading opportunities. Using the Variable Changing Price Momentum Indicator (VC PMI) as the central analytical framework, the report integrates weekly trend momentum and price levels to guide short- and long-term strategies. This setup reflects mixed signals, emphasizing the importance of closely monitoring critical levels for optimal trade execution.
Current Market Overview
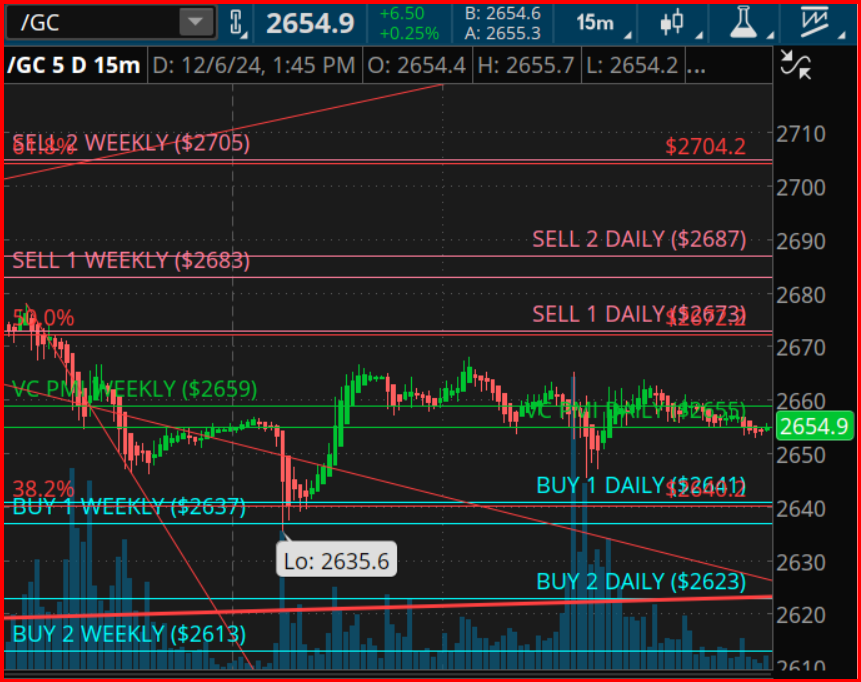
- Closing Price: $2,660
- 9-Day SMA: $2,711
- VC PMI Level: $2,659
Trend Momentum Analysis
- Bearish Confirmation: The closing price is below the 9-day SMA ($2,711), confirming a bearish short-term trend.
- Neutralization Point: A close above $2,711 would neutralize this bearish momentum and shift the outlook to neutral.
Weekly Price Momentum
- Bullish Confirmation: The closing price above the VC PMI ($2,659) confirms bullish price momentum.
- Neutralization Point: A close below $2,659 would negate the bullish momentum and shift the outlook to neutral.
Weekly Price Indicator
Short Positions:
- Profit Targets: $2,637 and $2,613
- Reversal Point: Switch to long positions on a weekly reversal stop near these levels.
Long Positions:
- Stop Level: Use $2,613 as a Stop-Close-Only (GTC) level.
- Profit Targets: $2,683 and $2,705
Cycle Analysis
- Next Cycle Date: December 15, 2024
- This date could mark a potential inflection point in the market, historically associated with significant price movements or trend reversals.
Strategic Recommendations
If Short:
- Take profits at $2,637-$2,613.
If Long:
- Enter positions near the support levels of $2,637-$2,613.
- Take profits at $2,683-$2,705.
- Use $2,613 as a stop-loss level to manage risk.
Conclusion
The gold market presents mixed signals, with a bearish short-term trend (below the 9-day SMA) but bullish price momentum (above the VC PMI). This divergence suggests traders should closely watch the critical range between $2,613 and $2,711 for signals of continuation or reversal. The December 15, 2024, cycle date adds a layer of uncertainty, necessitating vigilant risk management.
Disclaimer: This report is for informational purposes only and does not constitute financial advice. Trading in commodities involves significant risk and may not be suitable for all investors. Past performance is not indicative of future results.