Gold Futures (/GC) Standard Deviation Strategy Report
Date: December 20, 2024,
Prepared by: Patrick MontesDeOca
Target Audience: Gold Market Analysts, Traders, and Investors
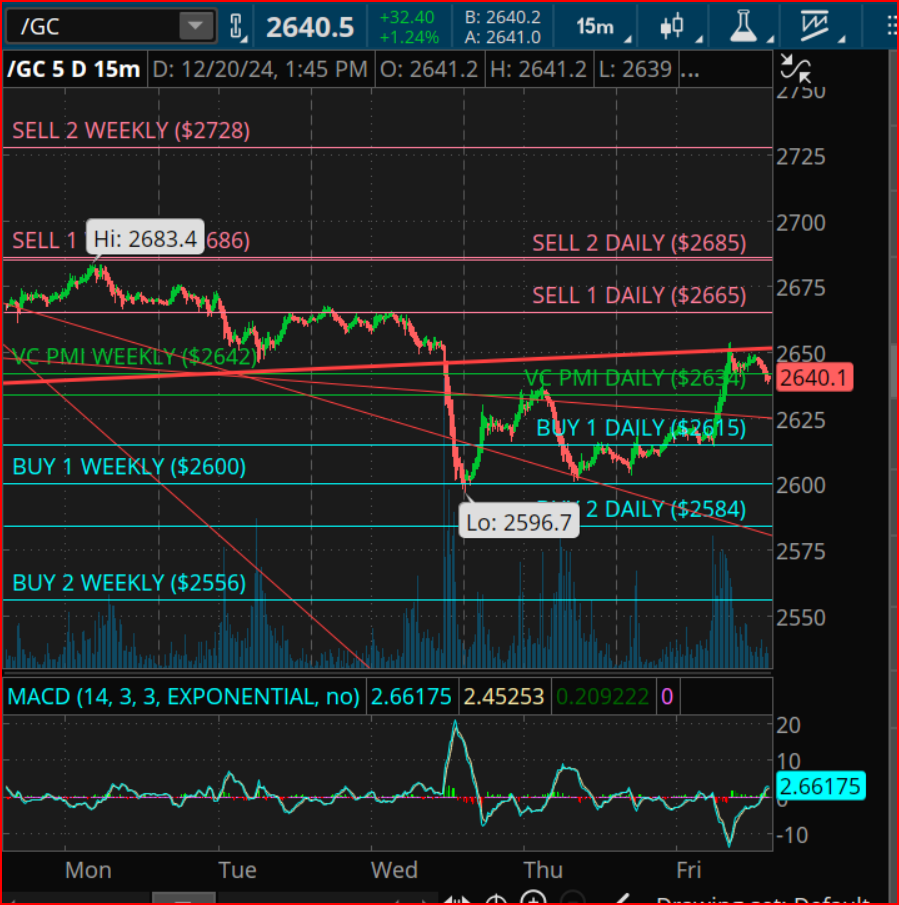
Chart Time Frame: 15-minute interval
Introduction: Market Overview
As of December 20, 2024, gold futures (/GC) are trading at $2640.5, up +32.40 points (+1.24%), reflecting a solid upward momentum on the day. The market sentiment appears bullish, as evidenced by the price action above key pivot levels and the MACD indicator signaling continued strength. This report delves into key support and resistance levels, market dynamics, mean reversion and strategic trading opportunities based on the technical analysis of the 15-minute chart.
Key Technical Levels: Support and Resistance
Weekly Framework
- Sell 2 Weekly ($2728): A significant resistance level indicating a potential profit-taking zone for bulls.
- Sell 1 Weekly ($2683.4): Currently near the recent high, it represents the next level of challenge for upward momentum.
- VC PMI Weekly Pivot ($2642): Acting as a critical weekly pivot point, this level serves as a benchmark for identifying bullish or bearish bias.
- Buy 1 Weekly ($2600): A strong support level that has historically triggered buying activity.
- Buy 2 Weekly ($2556): Deep support, indicating potential bottom-fishing opportunities if prices decline substantially.
Daily Framework
- Sell 2 Daily ($2685): A short-term resistance level to watch if the bullish momentum continues.
- Sell 1 Daily ($2665): The immediate resistance in the daily structure. Breaking above this level would confirm short-term bullish dominance.
- VC PMI Daily Pivot ($2635): Currently, the price is trading above this pivot, suggesting a bullish market bias.
- Buy 1 Daily ($2615): An important near-term support level. If prices dip, this could act as a pullback entry point for bulls.
- Buy 2 Daily ($2584): The lower daily support level, where significant buying interest is expected in case of a deeper retracement.
Price Action Analysis
The current price action shows a decisive move above the VC PMI Daily Pivot ($2635), establishing a bullish bias. The price recently bounced off a low of $2596.7, where strong buying activity was observed, pushing the market higher.
On the upside, the immediate target lies at $2665 (Sell 1 Daily), which aligns with a previous resistance zone. Beyond this level, $2685 (Sell 2 Daily) serves as the next major target, followed by the weekly resistance at $2728.
On the downside, if the price retraces, key support levels to monitor are $2615 (Buy 1 Daily) and $2584 (Buy 2 Daily). Any break below these levels could lead to a test of the weekly support zones at $2600 and $2556.
Momentum and Volume Indicators
MACD Analysis
The MACD (14, 3, 3) indicator reflects positive momentum:
- MACD Line: 2.66175
- Signal Line: 2.45253
- Histogram: 0.20922
The MACD line is trading above the signal line in positive territory, reinforcing the bullish momentum. No bearish divergence is evident, suggesting that the current uptrend is likely to persist in the short term.
Volume Insights
The recent upward price movement is supported by moderate volume, indicating steady buying interest rather than speculative spikes. Notably, there was a sharp increase in volume around the low of $2596.7, signifying strong demand at that level.
Trading Strategy Recommendations
Bullish Scenario
For traders favoring the bullish trend:
- Entry Point: Consider long positions as long as the price remains above $2635 (VC PMI Daily Pivot).
- Profit Targets: $2665 (Sell 1 Daily) and $2685 (Sell 2 Daily). A breakout beyond $2685 could open the path toward $2728 (Sell 2 Weekly).
- Stop-Loss: Place a stop below $2615 to protect against downside risk.
Bearish Scenario
For traders anticipating a reversal or correction:
- Entry Point: Consider short positions if the price fails to sustain above $2635 (VC PMI Daily Pivot).
- Profit Targets: $2615 (Buy 1 Daily) and $2584 (Buy 2 Daily). A break below $2584 could signal further weakness toward $2556 (Buy 2 Weekly).
- Stop-Loss: Place a stop above $2665 to limit potential losses.
Conclusion
The gold market currently exhibits a bullish bias, with prices trading above the critical VC PMI Daily Pivot ($2635) and supported by positive momentum on the MACD indicator. Traders should monitor key resistance levels at $2665–$2685 for potential breakouts, while keeping an eye on support levels at $2615–$2584 for any pullbacks.
As the year-end approaches, the market may experience increased volatility due to seasonal factors, economic data releases, and geopolitical developments. Staying disciplined and adhering to well-defined risk management principles will be critical for navigating these opportunities.
Disclaimer: This analysis is intended for informational purposes only and should not be considered as financial advice. Traders should conduct their own research and consult with a financial advisor before making trading decisions.