Square-of-9 and VC PMI Confluence: Gold’s Roadmap to $4,463
GDX Mean Reversion Trading
Date: October 17, 2025,
Prepared by: Patrick MontesDeOca
Target Audience: Gold Market Analysts, Traders, and Investors
Gold futures continue to trade within a controlled correction phase, balancing near key VC PMI levels, while the broader 30–360-day cycle structure remains bullish. The recent retracement from $4,392 to $4,200 aligns precisely with a mid-cycle mean reversion typical of the 30-day sub-cycle in a larger 360-day upturn that began in late September.
30–360-Day Cycle Dynamics
The 30-day trading cycle, anchored to the September 27–30 pivot low, projects a midterm trough and accumulation window into October 25–31. This marks the probable transition between the corrective leg and the next upward expansion. Historically, such cycles in gold exhibit acceleration following day 21, with volatility compressing before breakout.
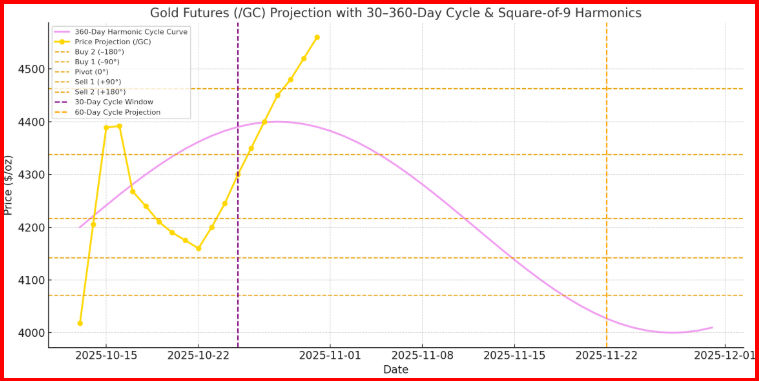
The Gold Futures projection integrating the 30–360-day cycle curve and Square-of-9 harmonic levels.
- The violet wave represents the underlying 360-day harmonic trend shaping the 60-day projection segment.
- The horizontal lines mark the key Square-of-9 geometric levels ($4,071, $4,142, $4,217, $4,338, $4,463).
- The purple (Oct 25) and orange (Nov 22) verticals highlight the 30-day and 60-day time windows for probable turning points.
This visualization reveals how gold’s current correction fits within the long-term cyclical rhythm—suggesting renewed upside momentum emerging into late October → November toward the Sell 1–2 targets.
The 360-day cycle, which turned up in early October after a prolonged consolidation, implies that the current correction is a post-turn retest, not a reversal. This long-term cycle remains aligned with a potential move toward $4,600–$4,800 by Q1 2026, provided gold sustains closes above the 9-day SMA and weekly VC PMI pivot at $4,205.
Square-of-9 Confluence
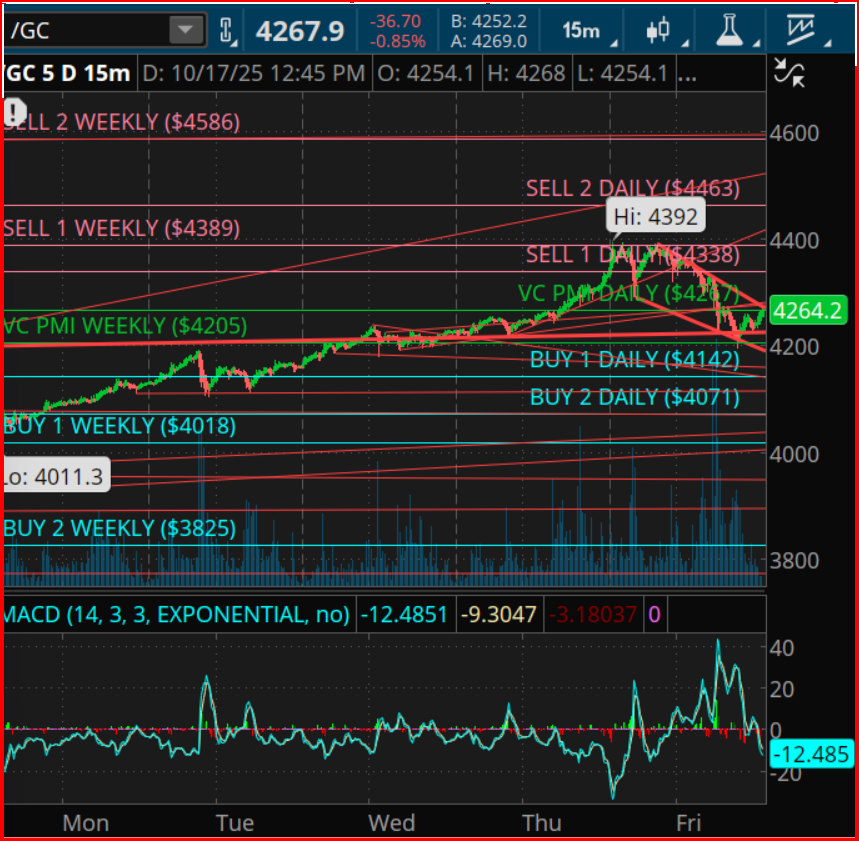
The Square-of-9 matrix, using the VC PMI Daily pivot at $4,267 as the central reference, confirms key harmonic resistance and support levels in alignment with the VC PMI AI framework:
- +90° (Resistance 1): $4,338 → aligns with Sell 1 Daily, where profit-taking is expected.
- +180° (Resistance 2): $4,463 → corresponds to Sell 2 Daily, an extreme mean-reversion sell zone.
- –90° (Support 1): $4,142 → aligns with Buy 1 Daily, the first demand pivot.
- –180° (Support 2): $4,071 → matches Buy 2 Daily, the deep value zone.
These harmonic intersections reinforce the VC PMI price map, creating a symmetrical reversion structure around the weekly mean ($4,205).
Market Implications & Strategy
As we enter the 30-day window (Oct 25–31), gold’s next move will define the trajectory of the quarter. Holding above $4,142 maintains the bullish continuation bias, targeting $4,338–$4,463. Failure to hold this level could extend the correction into the $4,071–$4,018 zone, setting the stage for a powerful 60–90-day reversal rally by late November.
Momentum (MACD: –12.48) remains negative but flattening, suggesting the market is nearing exhaustion on the downside. The Square-of-9 symmetry combined with 30–360-day cycle alignment points toward a potential breakout phase emerging into the next timing window.
Summary:
Gold is in a time–price convergence phase, completing its mid-cycle correction. As long as $4,205 holds, the long-term 360-day cycle remains bullish. The next acceleration is expected into late October–early November, with the potential to retest $4,463 and beyond—initiating the third leg of the 2025 hyperbolic advance.
TRADING DERIVATIVES, FINANCIAL INSTRUMENTS AND PRECIOUS METALS INVOLVES SIGNIFICANT RISK OF LOSS AND IS NOT SUITABLE FOR EVERYONE. PAST PERFORMANCE IS NOT NECESSARILY INDICATIVE OF FUTURE RESULTS.