Gold Market Analysis Report
Date: January 3, 2025,
Prepared by: Patrick MontesDeOca
Target Audience: Gold Market Analysts, Traders, and Investors
Hello and welcome to your Gold Futures Market Analysis Report!
We’re here to provide you with an insightful and easy-to-follow breakdown of the latest trends, technical indicators, and trading strategies. Let’s dive right in and see what’s happening in the gold market today!
Market Performance:
- Open: $2,636.1
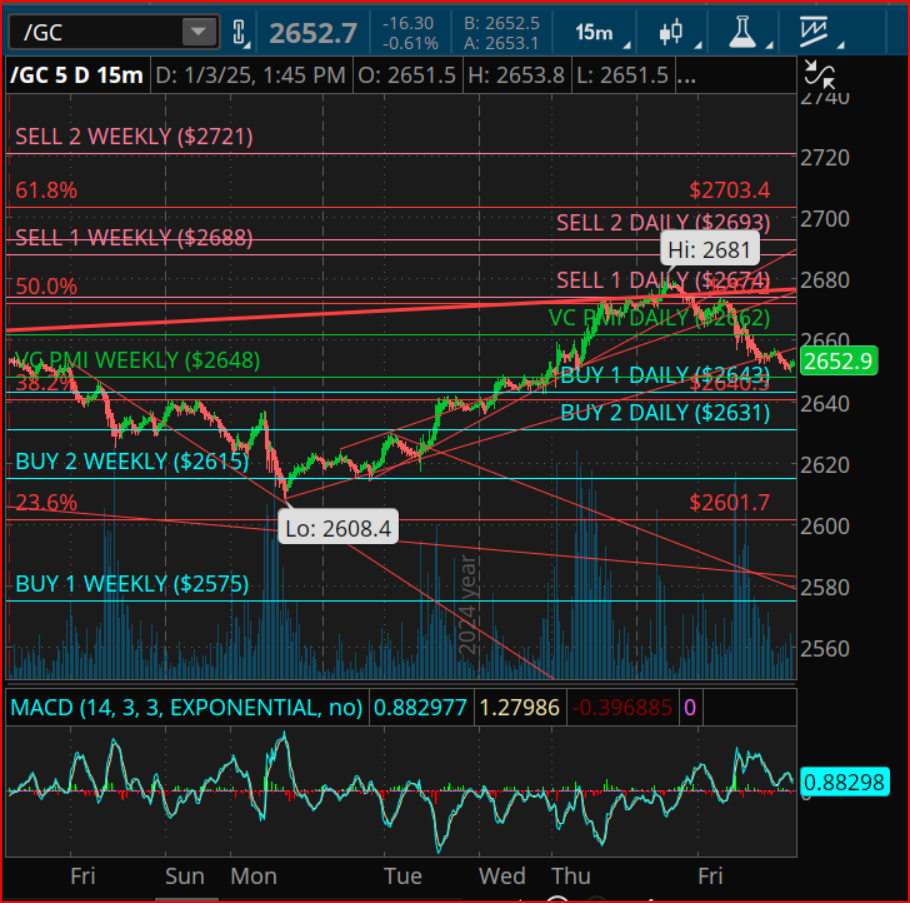
- High: $2,681
- Low: $2,608.4
- Close: $2,654.7
- Volume: 114,303 contracts
- Open Interest: 329,541 contracts
Technical Indicators:
1. Moving Averages (SMA):
- 9-Day SMA: $2,666.5 (The price is just below this level, hinting at short-term bearish momentum.)
- 18-Day SMA: $2,679.6 (A little higher up, acting as another resistance level.)
- 36-Day SMA: $2,572.5 (This could be a solid support level.)
- 54-Day SMA: $2,462.9 (Long-term support to keep in mind.)
2. Bollinger Bands:
- Upper Band: $2,800.4
- Lower Band: $2,534.7
- Midpoint: $2,667.5
Prices are hugging the lower bands, which could mean the market’s a bit oversold and might bounce back soon.
3. Relative Strength Index (RSI):
- Current RSI: 50–55
Right in the neutral zone—things are pretty balanced, but we’ll keep an eye out for any breakouts or dips.
4. MACD Indicator:
- MACD Line: 0.88 (Momentum is still positive but seems to be fading.)
- Signal Line: 1.27
- Histogram: -0.39 (A slight bearish signal forming—worth watching closely!)
Probability and Mean Reversion Analysis:
Gold futures are hovering near the VC PMI Weekly Mean of $2,648, which could mean we’re in for a move back toward the mean. Using Fibonacci retracement levels:
- 38.2% Level: $2,648 (Pivot point—right where we are!)
- 23.6% Level: $2,631 (Support zone)
- 50.0% Level: $2,674 (Resistance zone)
These levels give us a good sense of where prices might head next.
VC PMI AI Analysis:
Weekly Levels:
- Sell 2 Weekly: $2,721
- Sell 1 Weekly: $2,688
- Buy 1 Weekly: $2,575
- Buy 2 Weekly: $2,615
Daily Levels:
- Sell 2 Daily: $2,693
- Sell 1 Daily: $2,674
- Buy 1 Daily: $2,643
- Buy 2 Daily: $2,631
These key levels act like guideposts for making informed trades throughout the day and week.
Fundamental Analysis:
- Macroeconomic Environment:
Gold is still shining as a safe-haven asset due to global uncertainties and talks of interest rate cuts by the Federal Reserve in 2025. - Inflation Trends:
Inflation continues to support gold’s appeal as a store of value. - Demand-Supply Dynamics:
With central banks adding to their reserves and strong physical demand, gold’s fundamentals remain strong.
Trading Strategies:
Short-Term Strategy (1–2 Weeks):
- Bullish Above: $2,664 (Targets: $2,688–$2,721)
- Bearish Below: $2,643 (Targets: $2,615–$2,575)
Medium-Term Strategy (1–3 Months):
- Expect some back-and-forth between $2,575 and $2,721. Breaking above $2,721 could lead to a new rally, while a drop below $2,575 might mean trouble for bulls.
Risk Management:
- Long Positions: Consider a stop-loss at $2,631.
- Short Positions: Think about a stop-loss at $2,674.
Final Thoughts:
Gold futures are in a consolidation phase, holding near important pivot levels. Technical indicators and probability models suggest cautious optimism, while fundamentals remain supportive in the longer term. Whether you’re bullish or bearish, keeping an eye on those key support and resistance levels can help you stay prepared.
We hope this report provides helpful insights into navigating the gold market. Don’t hesitate to reach out if you have any questions or need further updates. Happy trading!
Disclaimer: This analysis is intended for informational purposes only and should not be considered as financial advice. Traders should conduct their own research and consult with a financial advisor before making trading decisions.