Gold Market Analysis Report
Date: January 17, 2025,
Prepared by: Patrick MontesDeOca
Target Audience: Gold Market Analysts, Traders, and Investors
Technical Analysis Overview
1. Current Market Position:
Gold futures are currently trading at $2,725.5, down 23.20 points (-0.84%). The market opened at $2,730, reached a high of $2,754.8, and a low of $2,715.6. Volume stands at 107,303, with open interest at 278,802, indicating sustained market participation.
2. Key Technical Indicators:
- Simple Moving Averages (SMA):
- 9-day SMA: $2,681.5 (short-term support)
- 18-day SMA: $2,698.4 (near-term support)
- 36-day SMA: $2,595.1 (mid-term support)
- 54-day SMA: $2,494.5 (long-term support)
- 90-day SMA: $2,340.5 (major trend support)
- Bollinger Bands (20,2):
- Upper Band: $2,791.6
- Lower Band: $2,595.7
- The price is currently trading near the upper half, indicating bullish momentum.
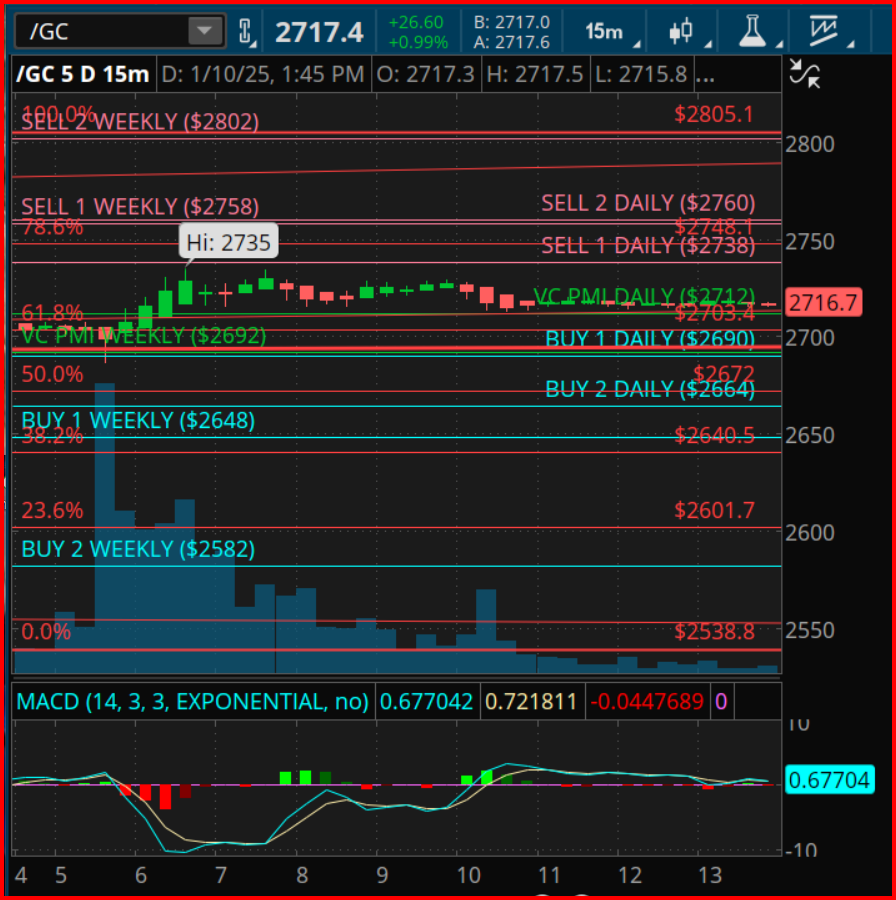
3. Fibonacci Retracement Levels:
- 61.8%: $2,748 (key resistance level)
- 50.0%: $2,703 (mid-range support)
- 38.2%: $2,672 (critical support)
4. VC PMI Levels:
- Sell 1 Daily: $2,763
- Sell 2 Daily: $2,775
- Buy 1 Daily: $2,734
- Buy 2 Daily: $2,717
A break above $2,748 could lead to further bullish momentum, while a breach below $2,703 signals potential downside.
5. Momentum Indicators:
- MACD (14,3,3): The MACD line is crossing above the signal line, suggesting bullish momentum is building.
- RSI Analysis: Estimated around neutral (50), with upside potential above 60 signaling strength and below 40 indicating bearish conditions.
II. Fundamental Analysis
1. Interest Rates & Federal Reserve Policy:
- Market sentiment remains influenced by potential rate cuts in 2024.
- A dovish Fed stance could weaken the USD, boosting gold prices.
2. Inflationary Trends:
- Persistent inflation concerns continue to drive demand for gold as a hedge.
- Lower-than-expected inflation reports could limit gold’s upside.
3. Geopolitical Factors:
- Ongoing conflicts and uncertainties contribute to gold’s safe-haven appeal.
- Any resolution of geopolitical tensions could reduce demand.
4. US Dollar Strength:
- The inverse correlation between gold and USD is crucial.
- A weaker dollar supports gold, whereas a stronger dollar exerts downward pressure.
5. Central Bank Demand:
- Increased gold purchases from China and India remain supportive.
- ETF inflows have shown steady interest in the metal.
III. Reversion to the Mean and Probability Models
1. Mean Reversion Zones:
- The short-term mean sits around $2,748, aligning with key resistance.
- Buy zones around $2,717, with a probability of price retracing to equilibrium.
2. Trading Probabilities:
- Bullish Scenario: A breakout above $2,748 increases the probability of reaching $2,775.
- Bearish Scenario: A drop below $2,703 could trigger further declines to $2,672.
IV. Trading Strategy Recommendations
1. Bullish Strategy:
- Entry: Near Buy 2 Daily at $2,717
- Target: $2,748 (Sell 1 Daily)
- Stop Loss: Below $2,703
2. Bearish Strategy:
- Entry: Near resistance at $2,748
- Target: $2,703 (50% Fibonacci retracement)
- Stop Loss: Above $2,763
3. Risk Management:
- Use trailing stops to protect gains.
- Monitor RSI and MACD for confirmation of trend strength.
V. Conclusion and Outlook
Gold remains in a bullish trend, supported by key technical levels and fundamental factors such as inflation, interest rates, and geopolitical concerns. The near-term outlook suggests consolidation with a potential breakout above $2,748 or a pullback to $2,703 if selling pressure increases.
Traders should stay vigilant to macroeconomic developments and technical signals to capitalize on potential opportunities in both bullish and bearish scenarios.
Disclaimer: This analysis is intended for informational purposes only and should not be considered as financial advice. Traders should conduct their own research and consult with a financial advisor before making trading decisions.