Gold Futures Monthly Special Report – Cycle & Geometry
Convergence
GDX Mean Reversion Trading
Date: August 30, 2025,
Prepared by: Patrick MontesDeOca
Target Audience: Gold Market Analysts, Traders, and Investors
Gold futures are trading at $3,516.1, having just tested a new high of $3,534.2. This rally
extends a parabolic advance that began after the breakout above the $2,200 consolidation band
in 2023. The momentum of this run is extraordinary, but when measured against cyclical and
geometric frameworks, the market is approaching a highly sensitive inflection zone.
Long-Term Structure
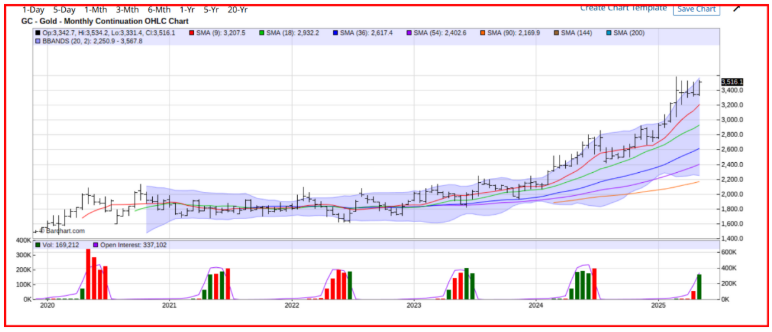
The monthly chart confirms a secular bull market in full force. The 9-month SMA ($3,207) and
18-month SMA ($2,932) are steeply ascending, layered well above the 36-month ($2,617) and
54-month ($2,402) averages. This bullish alignment is textbook. However, the price now stands
nearly 10% above the 9-month average and over 30% above the 36-month mean, placing it
in an extended condition.
The Bollinger Band framework reinforces this: gold is currently pressing against the upper band
at $3,567.8, an area where mean reversion has historically occurred.
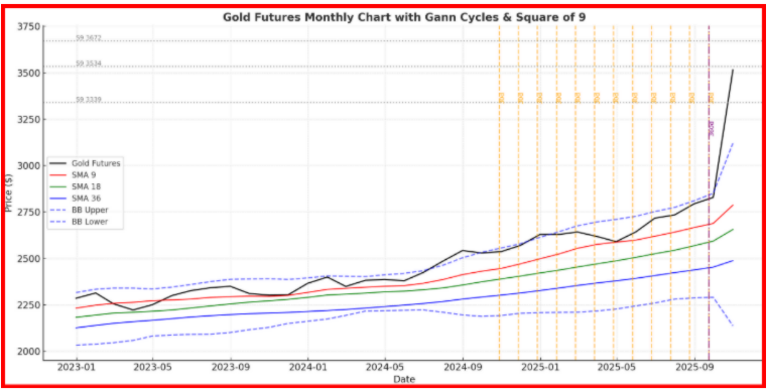
Gann Cycle Analysis
● 30-Day Cycle: The short-term 30-day Gann rhythm projects pivot dates into late
September to early October 2025, aligning with the immediate advance. This suggests
that while upside pressure could persist into early fall, topping behavior is likely within
that window.
● 360-Day Cycle: Anchored from the September 28, 2024 low, the full 360-day rotation
points to August 28, 2025 as a critical high-probability turning point. The fact that gold
has surged into this cycle window with prices testing upper Bollinger resistance
strengthens the case for corrective activity.
Square of 9 Geometry
Applying the Square of 9, the $3,534 high resonates closely with key harmonic rotations off the
$1,618 Fibonacci base pivot and prior highs at $2,070 and $2,350. This geometric alignment
underscores the probability of a time/price convergence, often a precursor to reversal or at
least consolidation phases.
Market Implications
The combination of cycle maturity (30-day topping phase, 360-day climax), geometric resistance
($3,534 zone), and volatility band extension ($3,567) creates a confluence of signals that
suggests gold is at or near a short-term cyclical peak. While the secular bull trend remains
intact, probability favors a mean reversion retracement toward $3,200–$3,000, which aligns
with the 9- and 18-month averages.
Conclusion
Gold’s long-term bull phase is undeniable, yet the cyclical and geometric evidence argues
strongly for caution. For traders, this is a moment to scale profits into strength and prepare for
a pullback that should ultimately reset the trend, offering renewed entry opportunities.
TRADING DERIVATIVES, FINANCIAL INSTRUMENTS AND PRECIOUS METALS
INVOLVES SIGNIFICANT RISK OF LOSS AND IS NOT SUITABLE FOR EVERYONE.
PAST PERFORMANCE IS NOT NECESSARILY INDICATIVE OF FUTURE RESULTS.